[[TOC]]
General recommendation
All deployments should use jemalloc library if possible. To use jemalloc with BIND 9.16, force the linkage via extra LDFLAGS variable:
./configure LDFLAGS="-ljemalloc"
Differences between BIND versions
BIND 9.16 uses more memory than BIND 9.11
There are two reasons for this:
- The networking model has changed. In BIND 9.11 there was a single "listener" that distributed the incoming work between idle threads. This simpler model was slower, but because there was a single listener, it also consumed less memory than the current multiple listener model.
- BIND 9.16 uses a hybrid of the new and old networking memory. BIND 9.16 uses the new networking code to receive and process incoming DNS messages (from clients), but it still uses the older networking code for sending and processing outgoing DNS messages (to other servers). This means it needs to run twice as many threads - there's a threadpool of workers for each function.
BIND 9.18 uses less memory than BIND 9.16
BIND 9.18 uses less memory than 9.16, similar to the memory usage in 9.11. The part that sends and processes outgoing DNS messages (server side) was refactored to use the new networking code and therefore uses half as many threads as BIND 9.16 used.
The other major change implemented in BIND 9.18 was the replacement of the old internal memory allocator from 2000 with the jemalloc memory allocator.
The internal memory allocator kept pools of memory for later reuse and would never free up the reserved memory. The jemalloc memory allocator is much better suited to the memory usage patterns that BIND 9 exhibits and is able to be both fast and memory efficient.
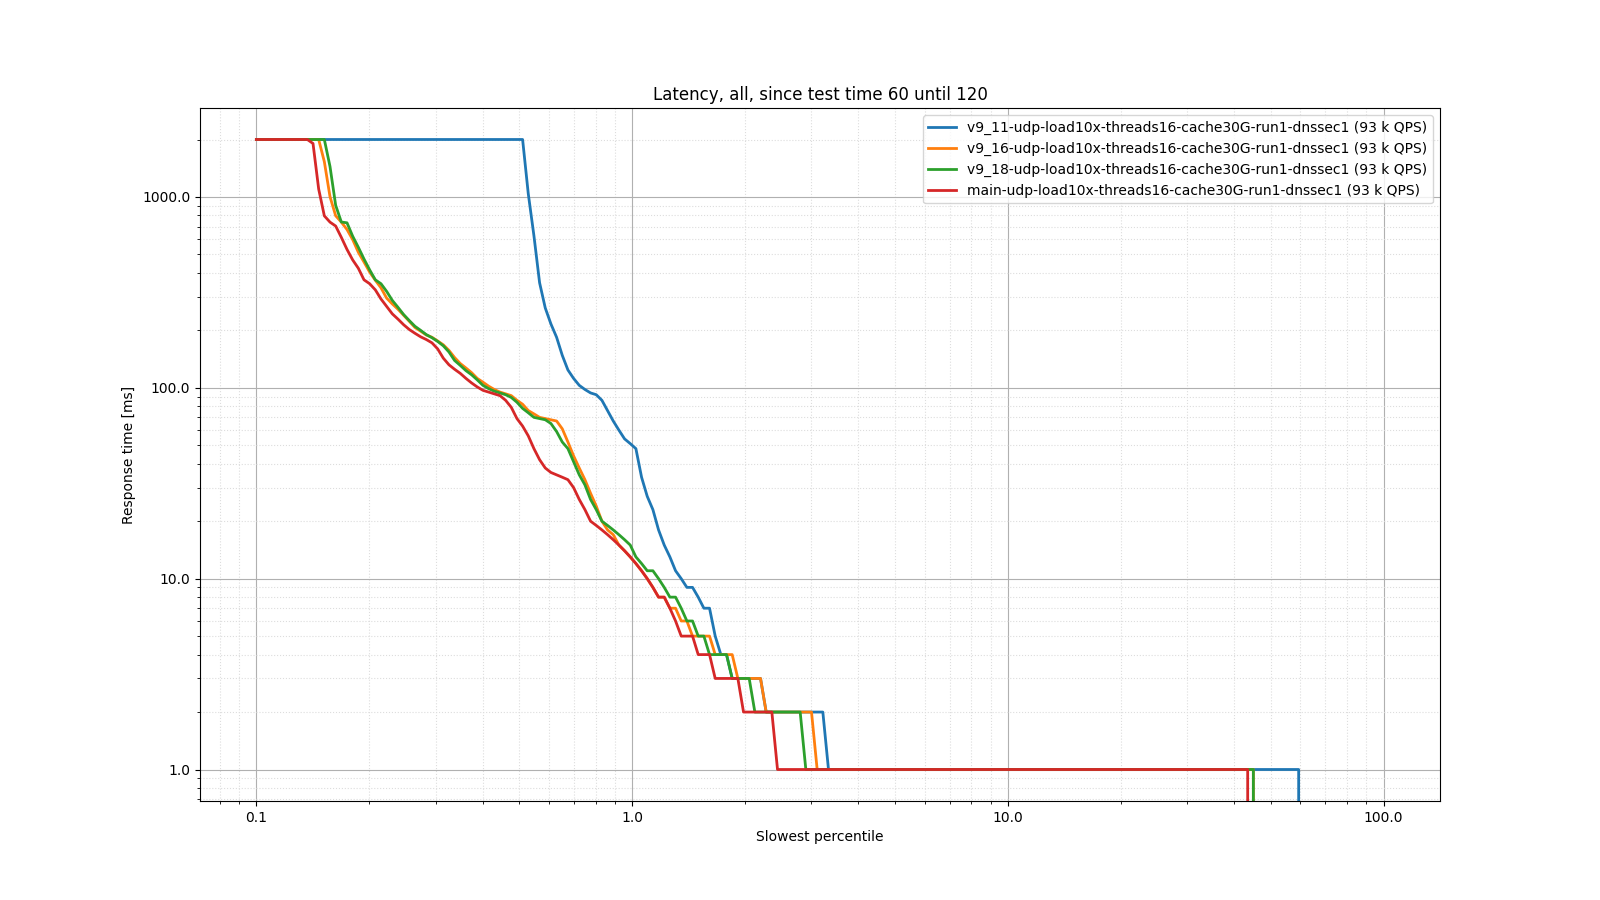
Resolver Benchmarks
Below are some basic graphs comparing memory usage in BIND 9.11, 9.16, 9.18, and 9.19 (aka main).
As you can see, 9.18 and 9.19 memory usage is in the same ballpark as 9.11, but the latency has improved greatly. The 9.16 memory usage is double, as described above (because it uses double the number of worker threads).


Limiting memory use
The configuration statement max-cache-size only affects the DNS cache and ADB (address database). All other memory uses remain unconstrained. This means setting the max-cache-size to 100% will eventually allow cache+ADB to consume all system memory and nothing will remain for other uses. This will subsequently trigger Out-Of-Memory Reaper finding your BIND 9 process and killing it without mercy.
Hard limit for testing
For experimental purposes, e.g. to verify that an expected limit is being honored, it is possible to artificaly limit memory available to a process using CGroups mechanism in Linux kernel. One possible way to limit memory usage to 1 GiB is this command:
systemd-run -p MemoryMax=1G -p MemorySwapMax=0 --user --same-dir -t \
    named -g -c named.conf # use the usual named parameters here
Before you draw any conclusions be sure to read:
- man page systemd.resource-control - look for options titled
Memory*andEffectiveMemory* - Linux Kernel documentation about Memory Interface Files.
Terminology
The basic BIND 9 memory management object is a "memory context": a running BIND instance has many of them. There are two reasons for separate memory contexts:
- logical separation - this includes both separate accounting, and different configuration, and
- contention and speed - access to a memory context pinned on a specific thread will not be blocked by different threads.
Measuring Memory
Measuring real memory usage can be tricky, but fortunately, there are some tools to help with that.
Measuring Memory Internally - BIND's view of memory usage
The BIND statistics channel exposes counters for individual memory contexts. The important values are InUse and Malloced.
InUsecounter shows the memory actively used by BIND,Mallocedincludes the memory management overhead.
Memory usage as seen by the operating system should be close to sum of all 'Malloced' values.
To summarize BIND's view of memory use, use script memory-json.py. The script parses the statistics channel output from URL <bind>/json/v1 and produces summaries. In case BIND was compiled only with XML statistics output take statistics from URL <bind>/xml/v3 and convert them to JSON using xq command.
For example, if statistics-channels statement in named.conf is configured like this:
statistics-channels {
        inet 127.0.0.111 port 8080;
};
you can obtain memory statistics using e.g. curl:
curl http://127.0.0.1:8080/json/v1 > stats.json
or if JSON support is not compiled in, use:
curl http://127.0.0.1:8080/xml/v3 > stats.xml
xq < stats.xml > stats.json
Finally, the script above outputs summary data (this is from main BIND branch):
./memory-json.py stats.json
OpenSSL: 268.8KiB 277.0KiB
uv: 6.1KiB 14.3KiB
libxml2: 1.0KiB 9.2KiB
<unknown>: 9.2KiB 17.4KiB
main: 1.4MiB 1.5MiB
loop: 10.8MiB 10.8MiB
zonemgr-mctxpoo: 20.5KiB 86.1KiB
clientmgr: 768.0B 66.4KiB
cache: 31.9KiB 48.3KiB
cache_heap: 2.1KiB 18.5KiB
ADB: 525.7KiB 542.1KiB
SUMMARY
INUSE: 13.1MiB == 13.1MiB
MALLOCED: 13.3MiB == 13.3MiB
Periodic measurement
In case BIND's memory usage gets out of hand gradually it's best to capture statistics over longer period of time. This time series will allow us to determine which component is allocating more memory over time.
A simple bash snippet is sufficient:
while true
do
    curl http://127.0.0.1:8080/json/v1 > stats-$(date -Iseconds).json
    sleep 60  # modify sampling period as needed
done
Measuring Memory Externally
The rule of thumb is
Don't use the
topcommand
There are better tools that are less misleading. Most importantly the VIRT value reported by top (and VSZ value reported by ps) are meaningless.
There are two better tools the are easily available on modern Linux systems - pmap and smem.
pmap
pmap provides detailed statistics, but can be too chatty - the basic usage is pmap -x -p <pid>. It prints information about all pages used by the program which includes shared libraries, the program itself and the heap. The important number is the last one "Dirty" - it shows the memory "used" by the BIND 9.
Example pmap output could look like this:
$ pmap -x -p $(pidof named)
3301879:   /usr/sbin/named -4 -g -c named.conf
Address           Kbytes     RSS   Dirty Mode  Mapping
000055872b587000      88      88       0 r---- /usr/sbin/named
[...too many lines...]
00007ffc52753000     132      40      40 rw---   [ stack ]
00007ffc527c1000      16       0       0 r----   [ anon ]
00007ffc527c5000       8       4       0 r-x--   [ anon ]
---------------- ------- ------- -------
total kB          760180   74324   60708
smem
smem provides fewer details, so if you want only a single number, run smem -P named and look for the USS column - this provides the information about memory used by the program sans the shared library. The PSS column adds shared libraries divided by the number of programs using those libraries, and RSS is the normal Resident Size.
$ smem -P named -a
    PID User   Command                             Swap   USS   PSS   RSS
3301879 ondrej /usr/sbin/named -4 -g -c named.conf    0 69664 70201 74324
Differences
There are couple of reasons that the numbers reported by the BIND 9 statistics channel might differ from the memory usage reported by the operating system.
External libraries
BIND 9 uses several external libraries - OpenSSL, libuv, libxml2, json-c and possibly others. All these also need memory from the operating system to operate. The difference should not be large, but it's also not negligible. If the difference between the used memory reported by the internal statistics channel and USS is large (on a busy server), then congratulations, you've found a leak in an external library. (NOTE: BIND 9.19 - the development version - provides own memory context for OpenSSL, libuv and libxml2 if the library versions are recent enough.)
Memory fragmentation
There's quite a lot of churn in the memory allocations and deallocations on a busy server, and memory gets fragmented - the default Linux allocator isn't particularly good with the BIND 9 memory usage patterns. Using jemalloc is strongly recommended as it handles memory fragmentation much better and is also faster.
Memory Profiling with jemalloc
When compiled (or even linked using LD_PRELOAD), jemalloc can produce heap snapshots based on triggers (time, size, ...). This can be later analyzed using the jeprof tool to see where the memory went.
The prerequisite for this to work is jemalloc library compiled with ./configure --enable-prof option. Check if the option is present in output of jemalloc-config --config command. If it's not present you have to recompile the jemalloc library.
The basics are:
export MALLOC_CONF="abort_conf:true,prof:true,lg_prof_interval:19,lg_prof_sample:19,prof_prefix:jeprof"
export LD_PRELOAD=/usr/lib/x86_64-linux-gnu/libjemalloc.so.2 # you don't need that if compiled with jemalloc
/usr/sbin/named # use your normal options and configuration that you use in production
You'll probably need to fine tune the lg_prof_interval and lg_prof_sample numbers (it's log base 2) to get the desired file size.
After running the benchmark or the regular workload, you should end up with bunch of jeprof.<pid>.<m>.i<n>.heap files. Pick the latest and run:
jeprof \
	--show_bytes \
	--nodefraction=0 \
	--exclude="default_memalloc|mem_get|isc___mem_get|isc__mem_get|mem_allocateunlocked|isc___mem_allocate|isc__mem_allocate|isc___mem_strdup|isc__mem_strdup" \
	/usr/sbin/named **HEAP FILE** --pdf > "jeprof.pdf"
More options can be found in jeprof manual page. These must be interpreted with knowledge of the BIND 9 internals. That said, if you are reporting what you think is a memory issue, attaching output of the jeprof will certainly help.
Memory Profiling Example
The output of jeprof can look like this (this is how the memory looks like after 1 minute dnsperf run).
See explanation how to read the chart. It's the same as for Google pprof tool, probably because jemalloc's profiling has some common history with pprof.
